Solid State Lidar (Neuvition): a quick look at precision
Author: Release time:2021-02-18 06:28:58
Point Clouds come with all sorts of shape and form, each with distinct pros and cons. Over the years I have used point clouds from camera (SFM, photogrammetry), super dense and noisy, from medical device, with nice volumetric quality, and of course from Lidar.
Now even Lidar points clouds can be very different depending on the sensing method. Aerial Lidar are going to produce different point clouds than mobile mapping (Riegl Lidar).
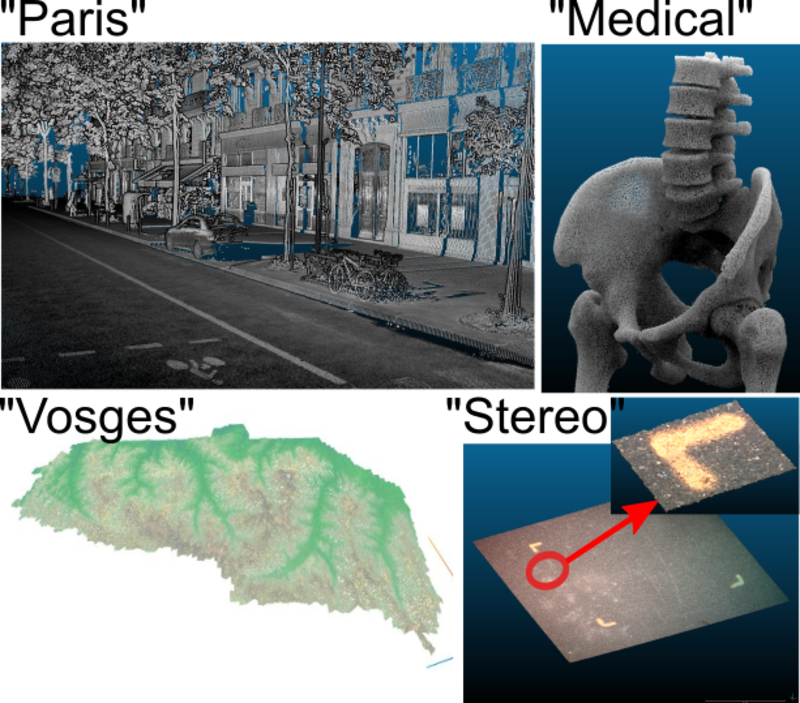
For mobile mapping, the common wisdom is that Lidar sensors are fragile, finicky and expensive. As they are essentially high-tech rotating lasers of mind-blowing precision. That’s where solid state Lidars enter the fray. With clever usage of optics, no moving parts (and maybe less $)! Of course that comes at the cost of precision.
The company Neuvition makes a variety of solid state Lidars, and they are kind enough to offer sample point clouds from their sensors (limited attributes though). So let’s have a closer look at the point cloud from Neuvition using my favorite CloudCompare!
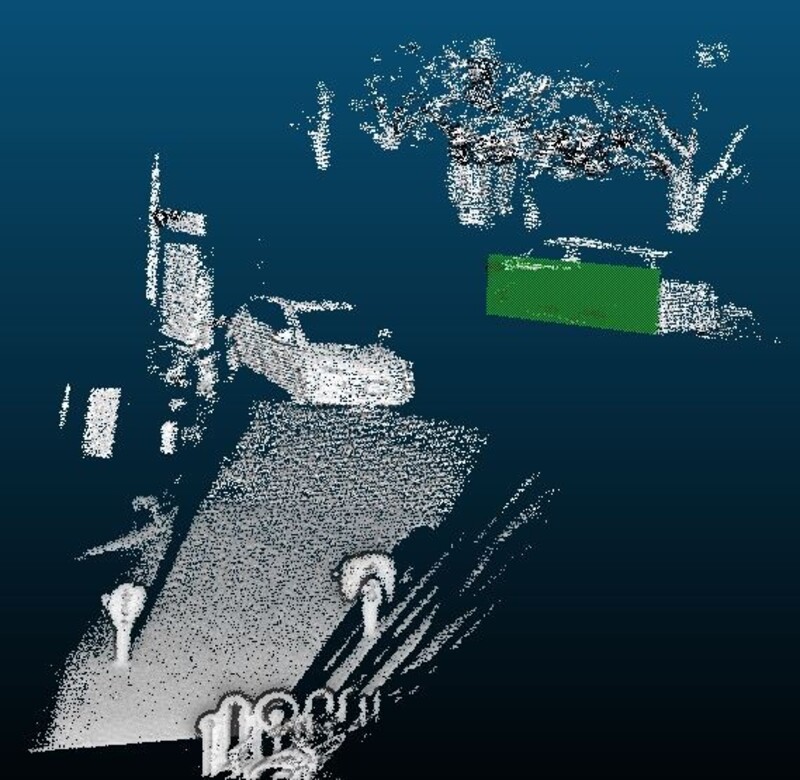
Neuvition device is of the line scanning type, which is reminiscent to me of the Velodyn (N fibers, each scanning a line by rotation). The field of view is of course limited compared to a Velodyn, which is totally normal. Here we have an urban scene with a bunch of street objects, cars and trees. I’ll look closer at the side of the car highlighted in green. The distance between the Lidar and the green plane is about 30 meters.
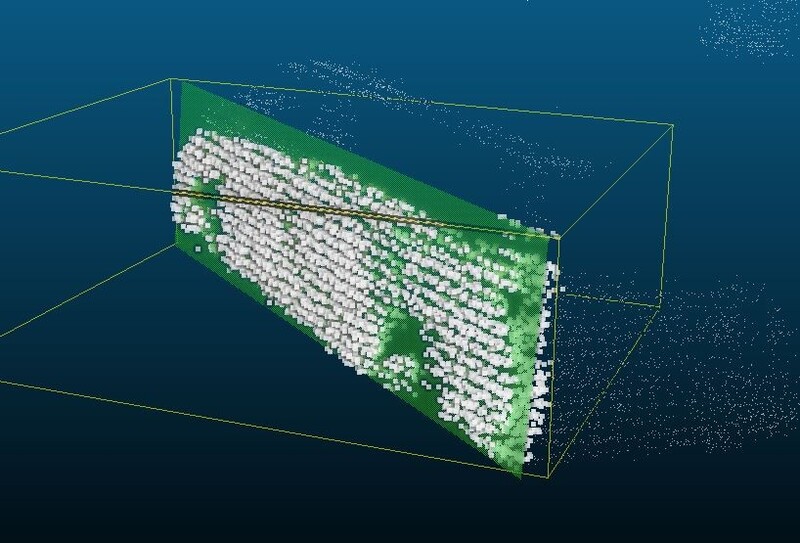
I’m mostly curious about the precision of the device, and thus I’ll use the side of the car as a testing ground. A car side is mostly flat and planar, so we can look at how far the points are from this hypothetical plane.
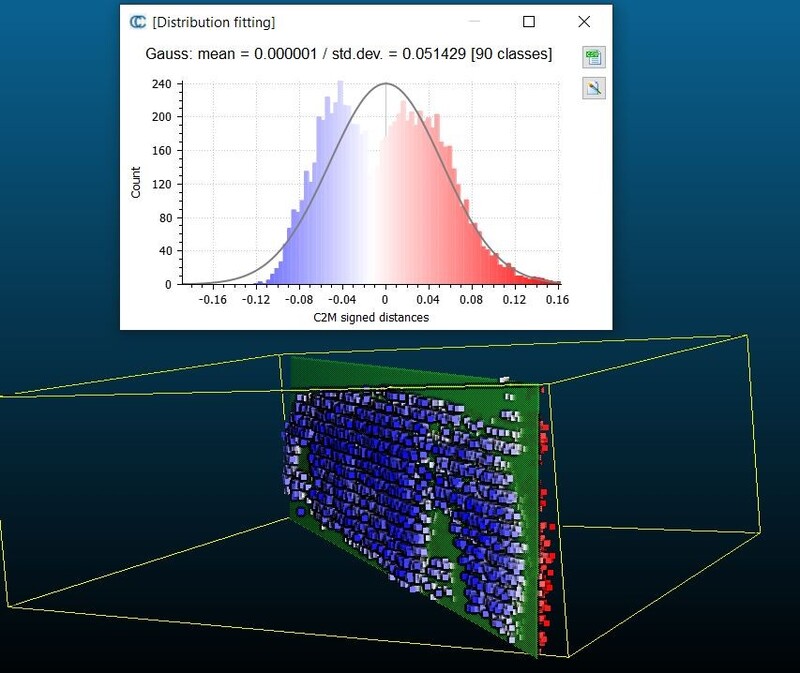
I manually segment the relevant points, then fit a plane. After that, I compute the distance between the points and the plane (red to white to blue). In a perfect world, all the points would be spot-on on the plane, and thus white. Here we can see the distribution of distance plot which shows an average error of +-5 centimeters. That’s comparable to the Velodyn I used during my PhD (2015), from memory.
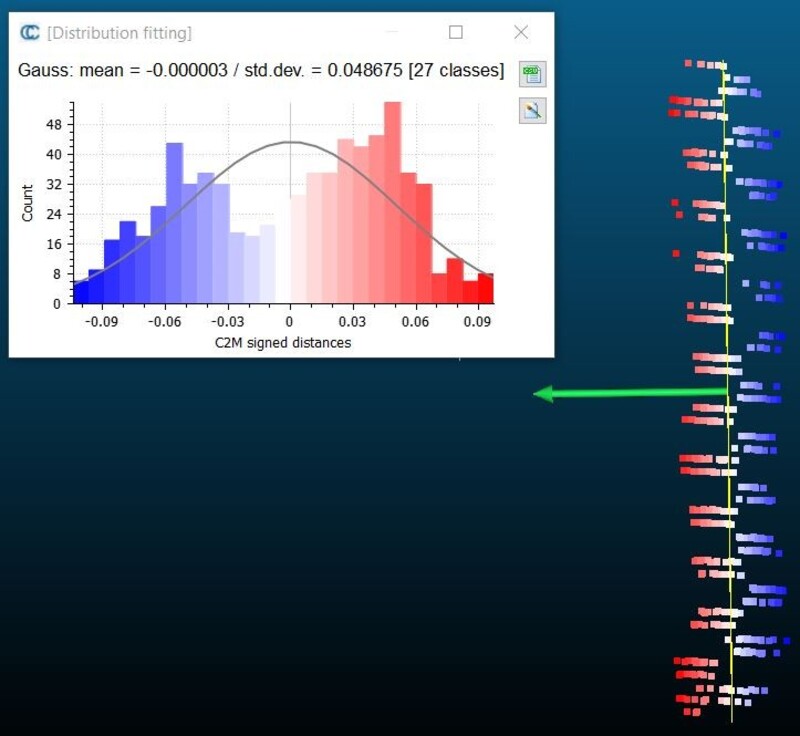
Here is the profile view of the car side (the arrow is the normal to the plane). We can very clearly see the horizontal patterns of each line of scan. In addition, pairs of lines alternate between underestimating the distance (red) and overestimating it (blue). That’s strange, I have no idea why it happens!

If we isolate one line of scan and look it from above (that would be the thickness of the car door), the points are perfectly aligned horizontally (I could not even measure the error with this point cloud), but randomly spread as far as the depth is concerned ( about 5cm).
Now for the fun, here is a comparison of car sides. On the left a car side viewed by the solid state Lidar (distance of ~30m), and on the right another car side viewed by a Riegl Lidar (distance ~5m), picked from my PhD (thanks IGN for this super cool time!). Let me stress that the Riegl Lidar used here was absolutely state of the art at the time, and probably costed many many times the solid state Lidar on the left.
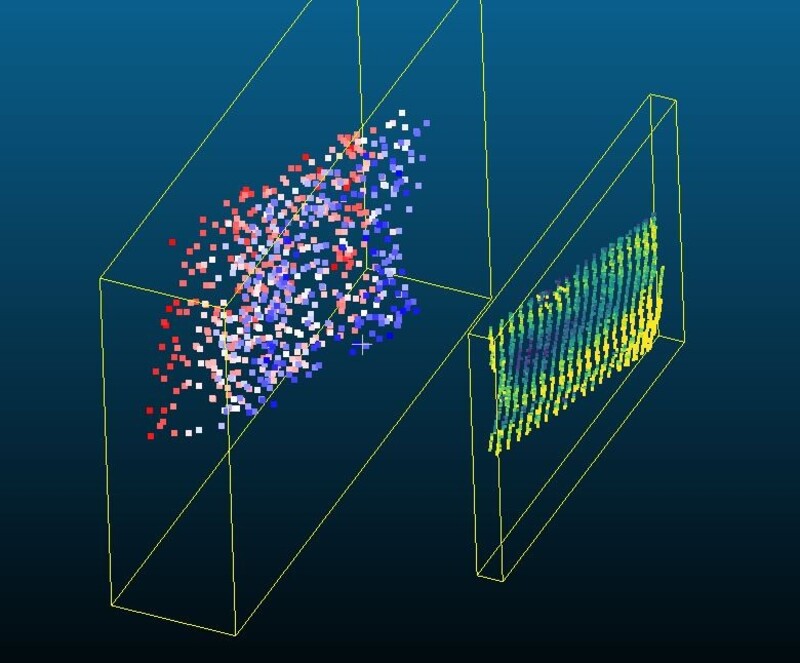
Overall, I must say I’m impressed by this solid state Lidar from Neuvition. The point density is good, the error is reasonable for their target usage (autonomous driving). I’m pretty confident the depth-estimation error could be reduced using one of the many approaches in the literature as the noise looks well-behaved, but that’s hard to say without the actual, raw output of the sensor.
It’s a very exciting development for us point cloud experts, as solid-state Lidar will hopefully finally democratize Lidar for a tone of cool applications.
Source:
Rémi Cura: Research Data scientist: Postdoc at M.I.T. 🔎Analyzing how 💲 from lobbying and campaign financing impact 🏛️ Congress